Category Archives: Bystander Speaks
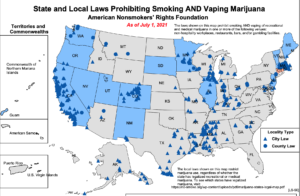
US Tobacco Control Laws Database
American Nonsmoker’s Rights Foundation maintains data on US state and local tobacco control laws and policies related to marijuana.
US Tobacco Control Laws Database
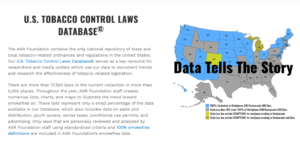
Additionally, it provides links to model ordinances and policies that can serve as a guidance document for jurisdictions that are seeking to implement a policy.
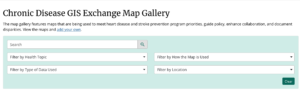
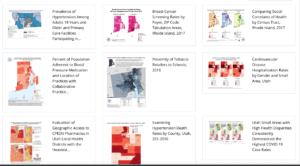
GIS Exchange Map Gallery
CDC’s GIS Exchange Map Gallery for demonstrating how maps are used for noncommunicable diseases and prevention
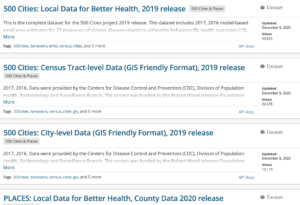
CDC’s 500 cities and places portal
Interesting crowdsourced applications developed by GIS Corps in response to the pandemic
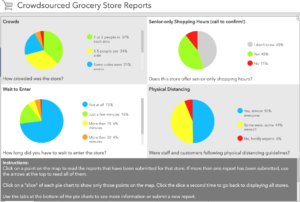
During the time of pandemic, GISCorps —group of volunteers who contribute in spatial data creation for humanitarian cause — developed interesting crowdsourced applications and web-mapping applications. These included allowing users to find vaccination sites based on where they live, identify grocery stores that practice social distancing and follow the safety protocol as well as report those that don’t adhere to the guidelines.
Below are some interesting applications developed by GIS Corps:
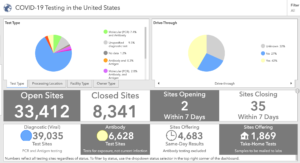
Here is an example of COVID-19 testing sites, type of site such as drive-through or not and the type of test that is offered.
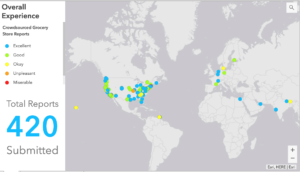
Here is another example of a crowdsourced app on safety and 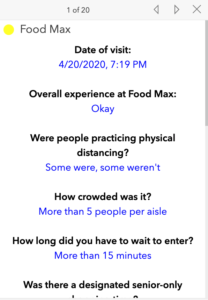 customer experience at grocery stores during the pandemic. This is how users can report their overall experience and alert other consumers about the safety protocols followed by the store, waiting time, and information that would help other consumers make a decision about visiting a particular store.
Additional examples of the apps related to COVID-19 can be found here.
Book Review: Steal Like An Artist
As an academic or as someone who enjoys writing to discover new trends and patterns, I view my quest to come up with research ideas as a creative endeavor. I also associate being creative requires an entrepreneurial spirit — with the difference being that a real entrepreneur invests capital in some form to get returns, while a scientist or a writer has to invest his or her time to come up with ideas that might bear a return or not, depending on whether that research gets funded or whether that idea makes it into a fine editorial piece or not.
If you view that your work requires some degree of creativity, then Steal like An Artist is just a less than 100 pages book that would inspire you to develop some principles in your pursuit of creative ideas. Interestingly, the entire book consists of cartoons/graphics with short notes around different principles that the author recommends.
The three principles that resonated with me the most are:
- Start from the mundane to make something extraordinary: Often we are trying to think “outside the box”. But one has to be inside the box first and be able to see things from multiple perspectives before one can step outside the box and see a different paradigm. The book discusses examples of successful artists and painters and singers who first emulated their role models and in the process by doing so, they found their distinct identity. Drawing a parallel to this, as a researcher or scientist, this could be following an existing method applied by several others in the field; then identifying a flaw in it or a marginal improvement that adds one’s distinct identity and viewpoint, to produce something new.
- Go unwired from technology: I really love this because it is so easy to get swamped in the flood of information at a click of a mouse and multiple tabs open in your browser. As a researcher when I want to come up with new ideas, I like to stay away from screen and draw mind maps around a central theme that I would like to explore. By doing so I am often able to discover what I already know on the topic, or the different areas that I’d like to explore around the topic, and if nothing then at least it gives me a structure around the idea that I need to build on my writing or my search query in Google scholar. Similarly, when I already have a lot of information, I again step back from the screen, and do the same exercise – in this instance, to develop a coherent structure around all the information that I already have and then use my laptop to type it.
- Go on a creative date everyday and consistently: All creative work is a pile up of “boring”, “mundane” tasks performed consistently to make something extraordinary. I agree to this by far the most because consistency is the most important principle in writing or solving a problem. There are several days when we feel we are being “unproductive”, but being consistent in working on it is the only way to get a breakthrough. As Woody Allen said that success is about 80 percent just showing up.
Book Review: Geek Heresy: Rescuing Social Change from the Cult of Technology
Why is it that a job posted on LinkedIn is for anyone to apply, but the person who is most likely to get an interview call is someone who either knows the HR or knows someone inside the company who is on his LinkedIn network? Why is it that even though internet is widely available in China, it cannot break the censorship walls built by the Chinese government? Even when technology is available to everyone, why is it that highly motivated individuals use it very differently and for very different purpose then those who are less educated and have very less aspirations in life?
While technology can give equal access to everyone, it cannot replace social access that only few privileged people have, which guarantees their entry for a job interview after controlling for skills and education. Similarly, without the right political and social institutions, freely available internet access to everyone still does not guarantee access to unbridled information. Or even when technology is available for anyone, the more educated, ambitious, and highly motivated individual will be very discerning in the use of internet for educational purpose as opposed to someone who would use it more for entertainment. Sounds like common sense, isn’t it? As much as it sounds so obvious, Kentaro’s book is an eye-opener for anyone who believes that technology can be an end in itself in solving certain social problems. Kentaro Toyoma makes a compelling case that technology cannot have any impact without nurturing the right political and social institutions; it cannot transform an individual who lacks the right motivation, judgment to make the right choices, and self-discipline and control to follow through the right choices . Though written by a computer scientist, this book is more written from the perspective of ethics and philosophy.
I met Kentaro when I had just started my career as a journalist. Kentaro was heading then Microsoft India Research Foundation where he was involved in interesting initiatives that harnessed technology for social change. The book is based on Kentaro’s experiences in India as a part of Microsoft Research Foundation. It was during this journey that he encountered several non-profits and organizations that were intending to drive social change through the use of technology such as one laptop per child and similar initiatives, but these intentions were not matched with the right outcome.
While the book has numerous examples and case studies of organizations that were successful in harnessing technology along with building human capacity to use it, it falls short to a certain degree on rigorous scientific evidence. Several examples are from education and micro lending space and based on anecdotal evidence based on his personal experiences with these organizations. The book could have been enriched by including more evidence from public health where it is commonly used to target patient adherence to treatment, follow-up plans, using text-based services that are designed to change key behaviors towards reducing the risk of certain diseases. Despite its shortcoming on rigorous scientific evidence from other fields like public health, the book is well-written, engaging, and drives home some of the fundamental principles that can predict success of a technology based program in transforming social change.
From macro-economists versus micro-economists to macro statisticians versus micro statistician: The gulf between big data and small data scientists
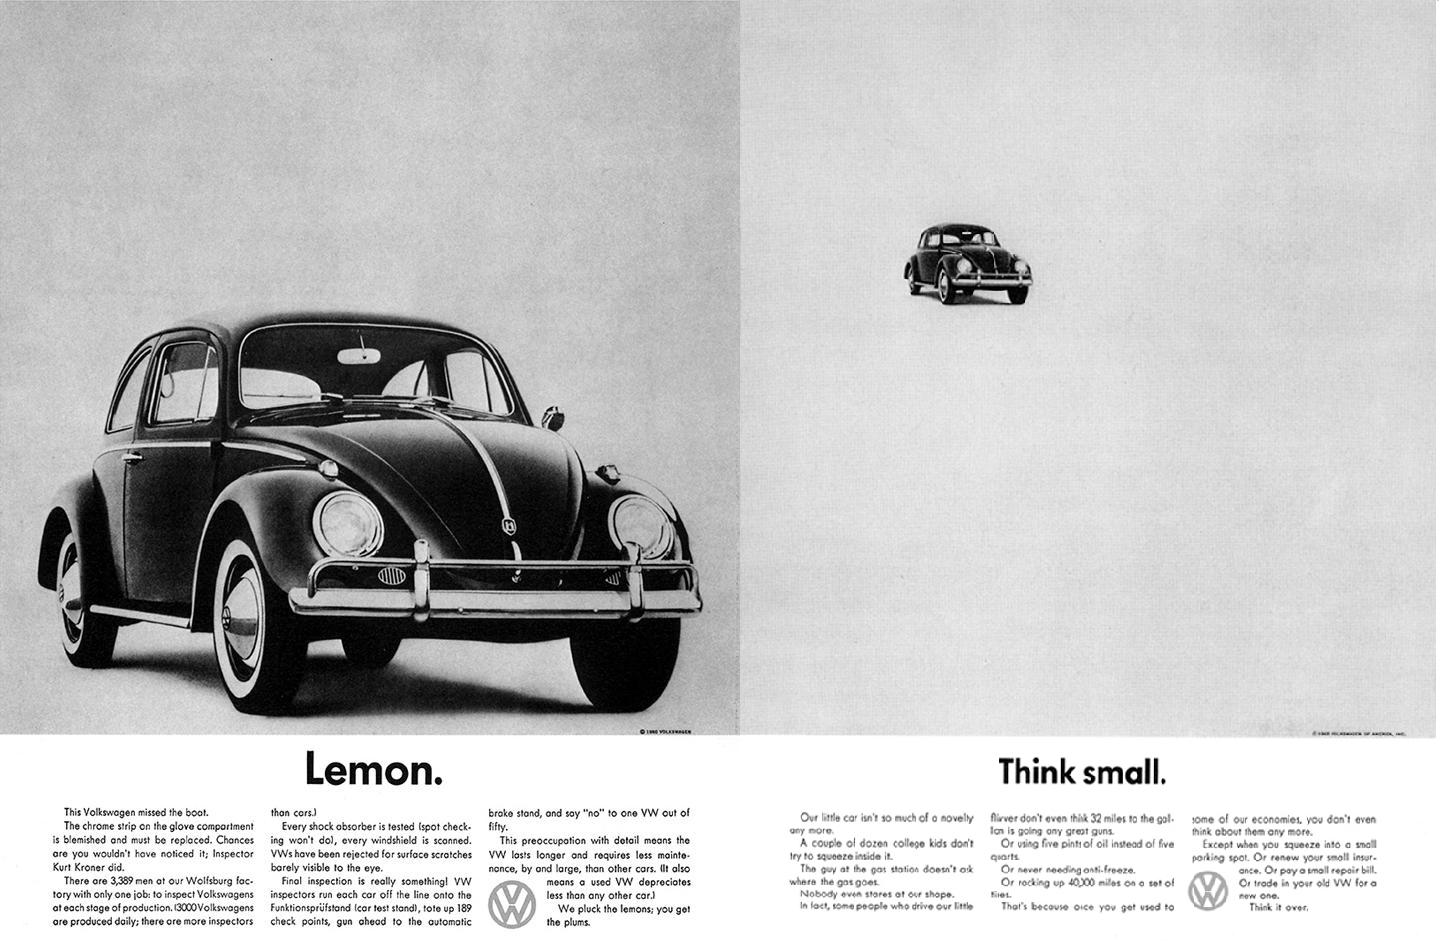 In the 1950’s and 60’s it was “Think small” ad for Volksgen’s Beatle car that marked a radical shift in an era that was dominated by large cars in the US. For anyone who studied advertising or works in the industry would recall this iconic add – considered as a classic in the field in several ways — but for the most part it created a new way of consumer thinking for the advantages of small cars versus big cars.
Today for someone in the field of data science, “big data” is the buzzword. More and more jobs are emerging in this area. Every day on my LinkedIn, I see several opportunities in this area. So I see the world of data science also facing a similar divide – big data versus small data. While we don’t hear much about small data as much as we hear about the term “big data” as it is more fancy, sexy, and requires highly sophisticated programming skills to model the problem, there are distinct problems and areas of application where each has its own place and utility.
Big data and some of its applications: Big data is associated with machine learning and applying algorithms to extract data from the web to search for pattern and trends based on millions of records. For instance, in text based analysis this would mean web crawling through millions of newspaper articles and editorials through which a computer can identify specific articles that a researcher or analyst is looking for. For a spatial statistician, this could mean employing computer algorithm to extract location information from millions of records about specific events of interest. The world of big data analytics is dominated by computer scientists, statisticians, political scientists interested in studying issues pertaining to conflicts, or public opinion. It is also dominated by companies and industries that are looking to capture consumer behavior and trends. So companies like Amazon and Google can model consumer pattern and forecast demand or decision-making.
Small data and its application: We don’t hear much of the term “small data”, but as a public health and policy professional, I see a lot of problems that need to be addressed in the field of public health, epidemiology, census that require one to deal with counts and small numbers that can be modeled correctly and be used to make valid inferences. This requires domain knowledge of distinct set of statistical models and tools. Organizations where knowledge of small area analysis and estimation would be helpful would be CDC, Census Bureau, and community level program planning and evaluation.
a) Survey methodology: For large scale health and population surveys implemented in developing countries, the sample is representative of the population at a larger regional scale, but often not for small geographic scale. In such a situation small area estimation techniques or interpolation is of interest to make inference about a geographic unit where sampling was not done on specific health outcome.
b) Sentinal Surveillance: This involves surveillance at a specific site or a location for detecting disease outbreaks or new cases of specific diseases. According to WHO sentinel surveillance is appropriate to gather high quality data when passive surveillance system ( generally based on data reported by health workers and health facilities) is not adequate to identify causal factors for certain diseases. However, because data is monitored at specific sites, hospitals, or locations, it may not be appropriate for detecting cases outside of the selected sites.
c) Community based program planning: In case of community and program planning, an application area would be improving a health intervention at a specific site and location. For instance, USAID allocates funds for HIV testing and treatment at specific sites and in several countries. Hence it might be interested in knowing which clinics are doing better in comparison to other clinics. According to the PEPFAR Annual report to the Congress, there exists a wide variation in disease burden and HIV risk at the sub-national level and sub-populations level. Hence, knowledge about distribution of cases around specific sites, uptake in the service utilization can help improve programs. Similarly, AidData, a collaboration between three universities, to track where aid money is going and in which programs by country and by year and based on the type of the project, works in the area of geospatial impact evaluation. Hence, it borrows traditional statistical methods such as difference-in difference and propensity score matching and other methods, but also takes into account site location of the project. It identifies sites where World Bank did not implement a project, thus acts as a control site. By accounting for location of the project implementation site, it considers heterogeneity in program outcomes while conducting impact assessments.
Economics as a discipline has always been demarcated between marco and micro economics. Is it time we divide statistics also as a discipline between macro and micro?
Where is the map, honey?
Last month I attended the International Geocomputation Conference hosted at University of Texas at Dallas. As a health policy researcher with a keen interest in the application of geospatial tools to solve problems related to services delivery and reduce disease burden, I was hoping to hear at least a few examples of what the next big trend would look like with the use of such tools for disease surveillance, preventing disease outbreaks, among others. However, the big trends discussed during the keynote session included applications mostly in the commercial space, while social and development sectors such as health sector trailing far behind. With increasing availability of smart phones, location based services are used commonly to obtain directions, find the nearest restaurant, or the drive time to the nearest clinic and so on. Companies like Uber, ride sharing app and community-traffic management and navigation app Waze have tapped on the location information of individuals.
But how about an app like Waze to know the waiting time and availability of doctors at crowded government or private hospitals in South Asia? Can such an app help a women who is in labor and about to deliver a child go to the right hospital instead of going to a crowded government facility, just to find that there is a long wait time after reaching there.
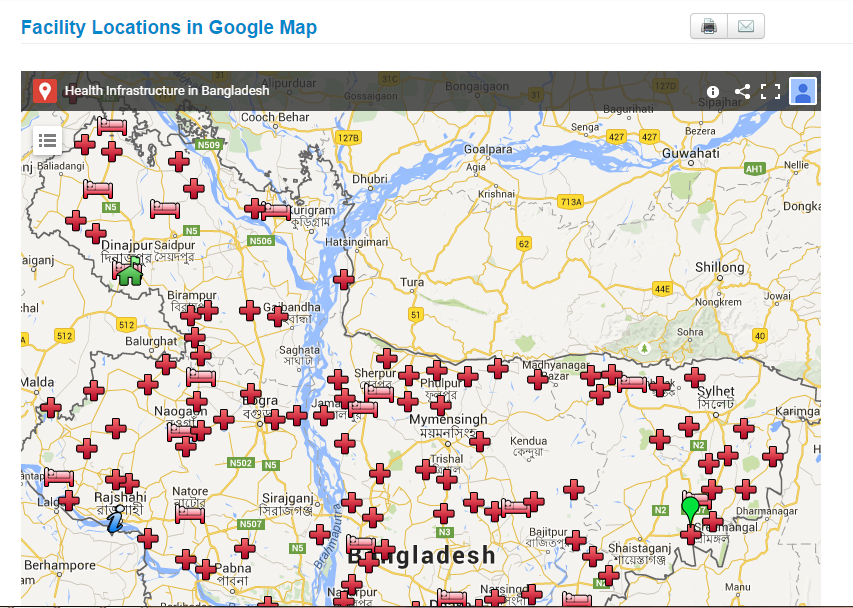
This is certainly utopian at this point, but it can be a possibility in the future. Health ministries in some countries have started using google map to display their health facility location information.
Here is the google application of BD hospital facilities data:
Brazil health facility search application
: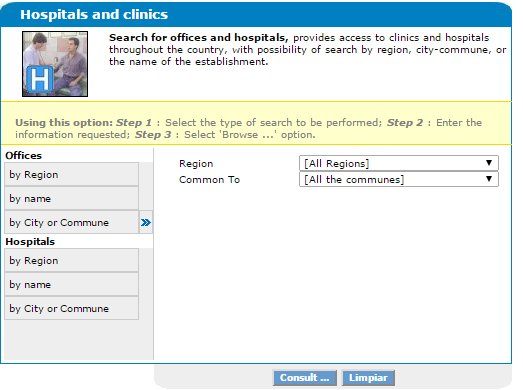
Argentina health ministry displays its health facilities infrastructure:

Several developing countries are using google maps for consumers to visualize health facilities location, type of health facilities, and the drive time to different health facilities However, in order for consumers to find utility with such visualization requires integration with other health indicators such as waiting time, availability of doctors, customer satisfaction rating, and other health infrastructure related indicators. This would help consumers make informed choices with regard to where to go for care. For policy makers, such health facilities data base needs to be integrated with information related to patient catchments i.e where are the patients coming from and for what type of services? Such information can help policy makers plug the gap in the system or identify specific locations or hot spots for certain diseases. There have been small scale initiatives ( in specific parts of some countries), mostly led by researchers and academicians in partnership with government and other institutions, but many of them have not been developed at the national level.
Most efforts to map health disparities, access, inequities come from health geographers and researchers instead of it being driven by the government and the policy planners. Hence the current scenario resembles more of a push rather than a pull strategy. To put it simply, it is more driven by supply from the researchers and academic community than it being a demand driven approach for decision making, where the health planners ask the question, “Where is the map, honey”? And only when health planners start asking such questions and demanding such information, we can expect location information to realize its full potential in the public health domain.
Reaping the technology dividend to capitalize on demographic dividend
Jan, 2014:
In health, the cliché is to get rich for countries before they get old. This is mostly in the context of reaping the demographic dividend that some of the developing countries through their young and growing population. But a young and a growing population can only be a ‘dividend’ for a country if it is healthy, well-nourished, and educated – a fact quite obvious to everyone. Despite this, the challenge for developing countries is to reduce the geographic variation in inequities in child health and development.
Take for instance, Bangladesh. It’s population demographic can be very favorable to its economic growth considering that the population, which is less than 15 years of age in Bangladesh, is almost 35 percent, another 56.5 percent constitutes between 15-60 years of age and only 8.2 percent of population is above 60 years of age based on the latest estimates from demographic and health survey . But for a developing country, which has a large proportion of population that constitutes children, the challenge of improving basic services delivery in terms of health and education also remains enormous.
One such attempt to improve child health was last month when the country launched one of the largest child immunization campaign for measles vaccine Rubella. According to the WHO South East Asia Regional Office website about 52 million children are targeted to get vaccination between January 25 and Feb 13 and marks one of the biggest campaign in the country’s history since 1979.
While this is a welcome initiative for policy-makers, public health scholars among others, a concern that continues to daunt involved in reaching out is to improve coverage in some of the geographic regions which are difficult to reach. There is well known evidence (Mushtaque Chowdhury et al) that there continues to be deprivation in certain geographic regions which are located in the hilly regions or in the low-lying planes. Furthermore, for those children that work in tea-estates and do not go to school might pose another challenge for policy-makers and planners in designing interventions that can help in reaching out to this unreached population.
For example, vaccination coverage is highest in Khulna over 94 percent and lowest in Sylhet at around 80 percent, and if one may peek within districts, then one may find more variation in equities.
One such attempt to map geographic inequities was by UNICEF to construct a child deprivation index at the lower administrative levels. The deprivation index that was created out of composite set of indicators was an attempt to map the geographic variation in social indicators at the zilla and upzilla level, and provide information to policy-makers and planners as to which are the worst districts and upazillas and which ones are faring better. Similarly, UNICEF also released the Child Equity Report for Bangladesh which maps district-level variation as well as variation within the districts on several indicators. In addition, organizations like ICDDRL-B also integrated the use of GIS in health and demographic surveillance system at its field site in Matlab since 1990’s to produce geo-referenced maps at the village level and Bari, which is cluster of group of households which share a comman yard, according to the Health and Demographic Surveillance System, Matlab 2012 report. However, the extent to which these geo-referenced maps are actually used in government decision-making is not much known, in my opinion.
With the plethora of tools for information at the disposal of policy-makers across countries, it seems that state failure in improving the quality of public provision of services can no longer be an option but should be the norm.