Category Archives: International Development

A marriage yet to happen: Donor coordination — from investment front towards intervention

When I took a class in International Development at Duke, one of the lessons I learnt from my Professor, who has been herself a county manager for World Bank for several years, was on donor coordination. While this was a theoretical lesson that I harbored for a few years, it was not until very recently that my own research brought me close to this reality. Lack of donor coordination has long been a buzzword when it comes to prioritizing development investments and strategies, but not much is said about the lack of coordination on the intervention front. Since I have been working on Bangladesh since the past one year, I think it is a fertile battle ground for donors investing in different projects, implementing different interventions, and producing evidence. But what is missing is connecting the dots between these different interventions:

Full vaccination districtsBelow70 districts

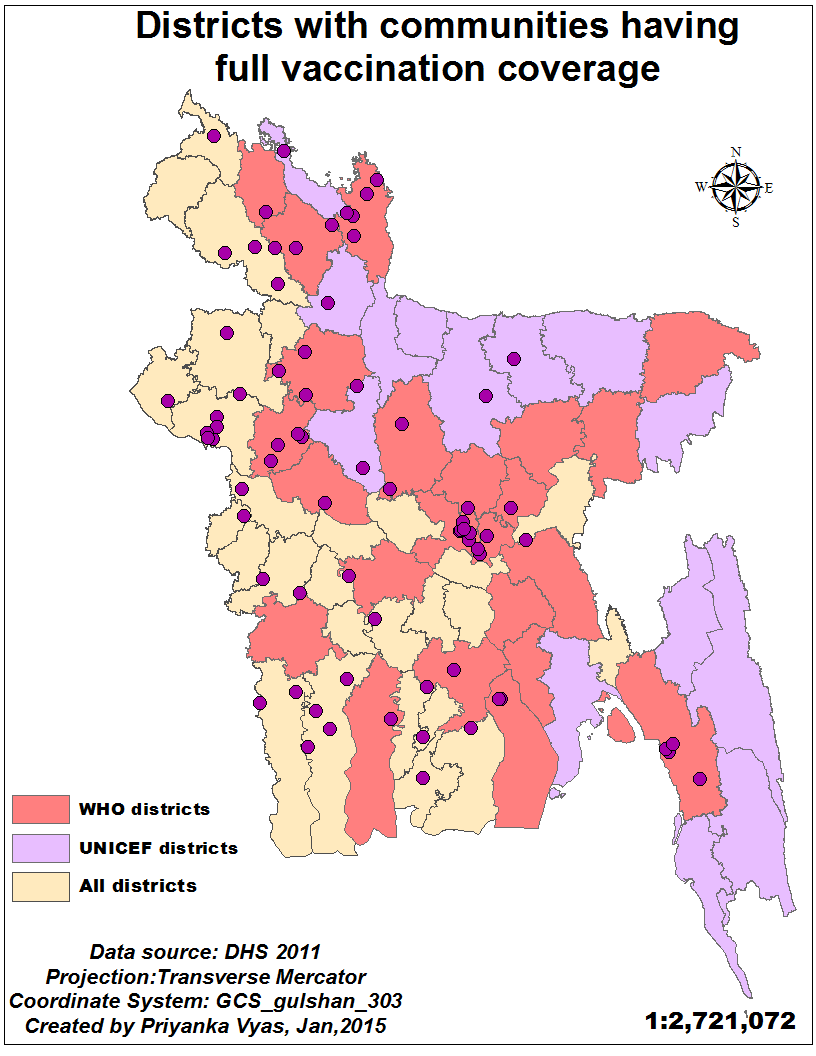
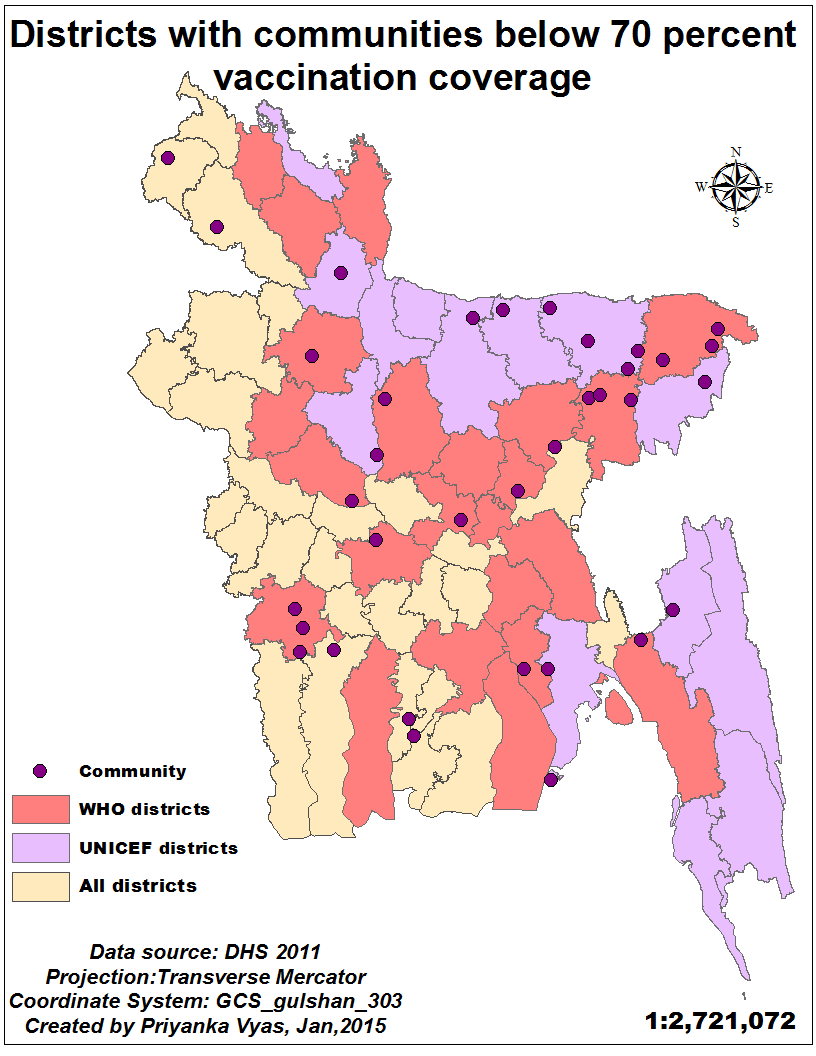
For example, in 2006 UNICEF identified about 14 low-performing districts to improve vaccination coverage. In 2007 WHO adopted another 23 districts that it regarded low on certain vaccine indicators. If you look at the above maps, you will see the districts adopted by WHO and those adopted by UNICEF.  Each point on the map represents vaccination coverage for a community-level of 20-30 households has been high or very low  based on the Demographic and Household Survey for Bangladesh, Historically, Sylhet and Chittgong have always had low health indicators because of hilltracts and low-lying areas. And this pattern is also evident on the map. Most of the pockets of communities with below 70 percent vaccination coverage fall in these intervention districts. The good news is that the interventions are targeted in the right geography and most communities with full vaccination coverage are outside these low-performing districts. But what can we say about communities with vaccination coverage between 80 to 90 percent and 90 to 95 percent coverage? There are several pockets of high immunization coverage in these low-performing districts and those which lie outside of these districts.

While WHO and UNICEF have been adopting districts for intervention, the Demographic and Health Surveys — which also provide GPS location data—- provide a classic opportunity to target interventions at the community level . Since district level aggregate data often mask variations in terms of pockets of low coverage and those with high coverage, location information at the community level can be a very useful tool. Unfortunately, despite all the efforts underway to collect spatial data, integrating it as a policy tool among different development agencies seems like a marriage yet to happen!

The real measure of performance-based financing

September, 21, 2011

What began in Latin America with a small cash transfer program has today emerged into a widely popular approach of financing health and education programs. Performance-based financing or results-based financing — the idea that programs should be funded based on the achievement of pre-determined outcomes and indicators- has almost become the modus operandi of aid agencies and development organizations.

While this ensures that aid money flows into countries that meet the targets to improve health outcomes, it does not compel governments to shell more money from their coffers. As a result many countries like Kenya, Ethiopia, Namibia, Pakistan, Bangladesh, Afghanistan have lowered their share of health spending between 2000 to 2009 while external resources have increased during the same period. On the other hand are countries that have increased their share of health spending even though external resources have increased and have also improved health outcomes.

Sample this: In 2000, Rwanda’s share of government expenditure as a percentage of total expenditure stood at 39.2%. The figure had increased to 43.2 percent in 2009. At the same time, external resources for aid as a percentage of total health expenditure had increased marginally by one percent to 53%. Contrary to some other countries which improved both their government expenditure as well as the share of t external resources, Rwanda was able to improve its health indicators and outcomes in a much greater proportion in comparison to some other countries. The country brought down its under five mortality rate from 106 in a span of decade, improve measles coverage from 74-92, lower maternal mortality rate from 1100 to 540 by 2009- the highest improvement among the 15 countries that are the top recipients of USAID.

Kenya’s story is almost the opposite of Rwanda if not completely. While it lowered government’s share of health expenditure from 45% to 33%, external aid shot up from 8.8 to 36% between 2000 to 2009 based on WHO’s data. Yet, health outcomes improved modestly. Under 5 mortality rate was lowered from 69-55, measles coverage declined from 78-74% and maternal mortality rate was reduced marginally by 30 to 530.

The contrasting tale of Rwanda and Kenya also reveals the contrast in fiscal management and dependence of many of the recipient countries. Some have been able to improve their resource allocation for health, lower their dependence on external aid or have seen an improvement in both internal and external resources. Others have not been able to do so, and some despite of an increased share of external resources have seen modest gains. Now this requires not just performance-based financing but strategically working with recipient countries to improve their fiscal capacity. Clearly, if more countries have to replicate what Rwanda has been able to do, it would be a real measure of not just performance-based financing but performance-based budgeting.

WebRep