Category Archives: Bystander Speaks

The Baptist, the Bootlegger and the Indian Health Care System


August 8, 2013:

In 1963 when Kenneth Arrow wrote his seminal piece on ‘Uncertainty &Welfare Economics of Medical Care’, it not just stirred the scholarly debate on the economics of health care but it continues to form the basis of the theory taught even in today’s health economics class.

But is this now changing? Arrow’s theory was based on the premise that unlike other goods and commodities, when it comes to medical goods and services there exists information asymmetry between consumers of health care and the suppliers— in this case the physicians and health care providers. As a result, physicians will always have an advantage in pricing as consumer cannot completely know as much about their own health needs as would a doctor.

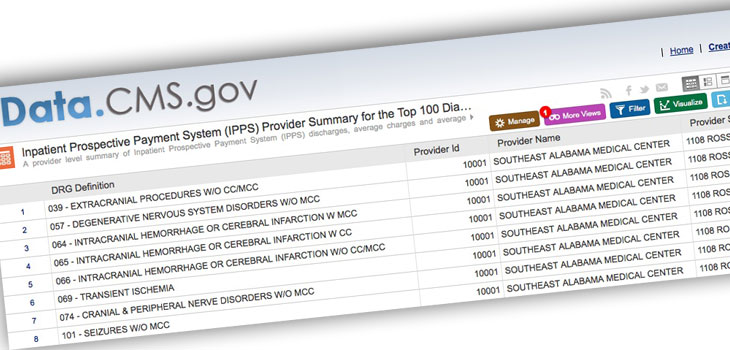
Today thanks to information technology that this asymmetry of information is narrowing in certain countries like the US.  In the US, the government has released data for the first time on variation in hospital prices for the top 100 diagnosis-related groups for Medicare patients.  Diagnosis-related Groups is a classification system to group patients based on certain diseases and procedures incurred to treat them, thereby making it possible to compare costs for the same disease. Since Medicare is a program funded by the US department of health and human services for its citizens above 65 and disabled, the government reimburses to the hospitals a part of the cost incurred by them for conducting certain procedures, and the remainder of the amount is billed to the patient or to the insurance companies. The way the reimbursement is calculated to the hospitals is based on a variety of factors such as its labor costs and other input costs based on a hospitals location in a certain metropolitan statistical area and its characteristics. Hospital characteristics that drive variation in prices for the same surgical procedure but in different hospital setting depend on whether the hospital is a teaching hospital or a non-teaching entity, the share of the population it treats with no insurance, the share of the population it treats which have a low income and thus participate in certain safety net programs, and on ownership factors such as whether it is a government, private, not-for-profit organization among others. The government then computes the reimbursement for all the hospitals based on some of these characteristics. Thus consumers, policy makers, and employers can compare not only what a hospital charges them for a specific disease  but also can compare it to benchmark average at a state and national level. And a prudent consumer can accordingly decide his or her options to avail care, given he has the knowledge about the standardized disease code or the procedure for which he or she will be operated.

Now is this relevant in the Indian context? Importantly, can it be possible for the government to regulate the hospitals and the insurance companies in publishing this kind of data on hospital costs associated with the same surgical procedure?  Researchers at the Public Health Foundation, Chatterjee, Sushmita and Laxminarayan, Ramanan recently conducted a similar study to detect variation in hospital costs with a sample of 5 hospitals with varying characteristics such as private, district level or tertiary care among others. And any such study that could cover more hospitals by a researcher will have limitations because only the government can have the wherewithal to furnish large scale national data of this kind.

While in a country where out of pocket expenses constitute a fairly high share of overall health spending in comparison to other countries and an increased share of tertiary care and multi-speciality hospitals are being concentrated in urban settings, this kind of information can certain help consumers within the same geographical area to make better informed decisions or those travelling from smaller cities as well.  At the same time increased transparency in hospital prices could also possibly benefit the medical tourism industry clients who currently can view the nearest hotels but not compare the prices of another hospital in its proximity.

But unlike in the US where the government provides subsidies even to the private hospitals depending on their teaching/non-teaching status, treatment of low-income population or without any form of health insurance, this is not the case in India.  This also makes hospitals less accountable to the government and in complying with the latter to provide such data.

When it comes to making public policy decisions by the government, there are always two parties that favor the same regulation for completely different reasons —the Baptists and the bootleggers. The Baptist will favor a regulation for ethical reasons; the bootlegger will because increased regulation would benefit his own industry. Extending the same analogy in the Indian health care setting, the Baptist would certainly be the consumer and non-profit organization advocates who will benefit and would favor such a regulation even on ethical grounds. Who will be the bootlegger? Will it be the medical tourism industry or the health insurance companies?


Need for a standardized innovation policy index:

ADB Social Protection Index

July, 2013:

Last month the Asian Development Bank released the Social Protection Index, which ranks countries based on their welfare programs. The index is mostly based on two parameters- the depth & the breadth of the coverage. While the depth is measured based on the benefit package offered to the beneficiaries, the breadth is based on the number of beneficiaries it covers. It does so using a simple formula of dividing the total program expenditure on welfare schemes by the total number of intended beneficiaries in all the schemes in order to come up with a ratio.

Even though the index is a first step to develop a methodology towards making cross- country comparison on their welfare schemes based on certain standardized measures, the question still remains of the context. Can one country follow another country’s policy with a completely different context? And can they replicate the success of one county in an entirely different setting? This could be similar to an apple and an oranges comparison whereby one country may have different welfare scheme than the other or the time period could be different. So for example, if South Korea started in 1988 its policy to provide health care coverage to its entire population and achieved a certain depth & breadth in a specific time frame, would it be a fair to compare its ratio to another country’s welfare program ratio based on shorter time frame. Well, the ADB has tried to reduce this variation by coming up with index based on region as well as by income. Hence, countries with similar economic growth can compare how well their social protection index fares in comparison to another.

Thinking on similar lines in terms of policy innovation, there is always a question as to how is it some country has been able to deliver a policy successfully and scaled up while some others may not have been? Unlike technological or manufacturing innovation which can be measured in terms of a new product launch or path-breaking model, policy innovation can be in two instances:

1)  When a state truly launches a new program which has not been initiated before.  For example, the first cash transfer program in Latin American or a new way of financing health program or delivering a vaccine.

2)When a country is able to achieve scale that others with similar economic and political structures are finding it hard to achieve.

Considering that there are several research grants in this area and innovation being the buzzword, maybe there is lack of evidence due to which there is such a growing interest in the scholarly and development practitioner community. So if one was to come up with a policy innovation index, then, what would be the parameters to make a standardized comparison of policy or programs:

1)Time Period in which policy was initiated and launched, bringing consensus from all stakeholders

2) The scale at which it was delivered

3)The process which enabled it

One attempt to compile policy innovation in health care is done by the Center for Health Market & Innovation. They have built a huge portfolio of programs in several parts of the world and categorized their innovation in 5 areas: 1)Health financing 2)Organizing delivery 3)Regulating performance 4)Changing behavior 5)Enhancing process

But in each of the category all the programs are different in terms of their approaches. So then how do you make a comparison of which program was more successful, which were the processes followed that made it more successful while another program adopting a similar strategy would have failed.

In other words, how do we build evidence to find out what works and what doesn’t?  As Don Hicks, Professor of Research Design points out, “You really build evidence by taking the same dependent variable and the same main independent variable in different settings and then trying to assess what is leading to variation?”

This would make sense if we would like to know about a successful HIV Aids program or a Tuberculosis prevention and reduction program.  By successful I mean a program or a country that has demonstrated substantial reduction in disease prevalence or in improving overall outcomes.  If we were to take the same dependent variable on outcome measures and have the same intervention as the main independent variable across several different settings, while controlling for certain processes,  to see whether a program could be scaled or not, would be one possible way to understand which innovation in HIV aids really works. And if the same main independent variable fails to produce desired outcome in a different setting, then this would give a clue as to the institutional factors and problems in delivery of the program that made it successful or failure.

While knowing all the good and diverse recipes is a great thing, sometimes it is also useful to know a standardized recipe that works too.  If  “innovation lies in delivery”, and by delivery Dr. Hicks means scaling up, then certainly one needs a more standardized measure to compare similar programs, similar interventions, similar time period and different settings to truly know the missing gaps. Acknowledging that a randomized experiment may not be possible, this kind of comparison could possible answer to not just which innovation works but also the process associated with it.  Just as a standardized Z score makes it possible to compare variables with different units by converting it into a unitless statistic, metaphorically speaking, a standardized policy innovation index could well reduce the variation and serve a similar purpose.


Arrow & Information Assymetry

CMS_CMSWebsite_WEB.jpg

July 2013

A classic opportunity to test causality:

In 1963 when Kenneth Arrow wrote his seminal piece on ‘Uncertainty &Welfare Economics of Medical Care’, it not just stirred the scholarly debate on the economics of health care but it continues to form the basis of health economics theory even in today’s health economics class.

But is this now changing?  Arrow’s theory was based on the premise of asymmetric information between the consumers of health care and suppliers — in this case the physicians and health care providers — due to which the physicians will always have an advantage on pricing as consumer cannot completely know as much about their own health needs as would a doctor.

 However, with the increasing information on cost and quality being made available to consumers by the Center for Medicare & Medicaid seems to be bridging this asymmetry of information. In May 2013 the Centre released data for the first time on variation in hospital prices based on top 50 diagnosis-related groups. Thus consumers, policy makers, and employers can compare not only what a hospital charges them for a specific disease  but also can compare it to benchmark average at a state and national level.  Further, the Agency for Health Care Research and Quality along with other departments of Health & Human Services launched various initiatives to produce standardized measures on the quality front. The data on health quality outcomes and indicators of hospitals is becoming increasingly refined over the years as more standardized measures are being produced to compare hospitals, and increasingly more tools are being developed on this front. These are a mix of process and outcome indicators such as hospital associated infections acquired by patient, readmission rates, reduction in hospital readmission rates, various hospital care process measures, how well each provider compares at state and national level among several other metrics.

While health outcomes are a function of medical care inputs as well as socio-economic factors such as education, life style among others, a fact acknowledged not just by Arrow but also based on scientific evidence, the growing information brings a boon for consumers as well as researchers.

From a consumer perspective there is now more information to correlate cost and quality.  But it is even more interesting from a researcher’s perspective and those studying economics of health care.

The key question lies:

-How are hospitals responding to this increased pressure on publishing cost and quality data?

-How is this changing incentive structure changing the processes and quality measures?

-Is it changing the outcomes?

-How does this increased transparency in hospital data reduce the asymmetry of information?

-And what does it bring for the consumers?

This is a historic time for members in the research community – a classic opportunity for a pre &a post design or a comparative change design of two group equivalents.

The taste of pudding lies in eating, so lies the taste of any high quality research in building evidence. The time is ripe now.


Power flows from the purse strings of local governments:

Mao.jpg

July, 2013

India is fast moving on reforming its welfare system by providing a unique identification number to all its citizens—  of which the biggest advantage is believed to be accrued to people who live below poverty line or who face challenges to claim any welfare benefits.  The country is targeting to enroll about 600 million people under the scheme known as “Aaadhar”  by 2014, almost double of  what the current enrollment stands at.   The entire initiative will pave the way for an electronic system to deliver welfare programs to its citizens by providing a unique identification number and track these welfare payments.

While there is little doubt that such an initiative could reduce corruption, wastages and inefficiencies in its public delivery system, the question is to what extent can India dramatically improve development outcomes based on its transformed system of delivering subsidies?  Can India replicate the success of countries such as Brazil and China in scaling up its welfare system and  being able to  rapidly deliver benefits to a large number of population in a short time frame?  China has already embarked on an ambitious program of providing health care to its rural citizens. Brazil started the process way back in 1988 when it amended the constitution in 1988.

How did these countries achieve this? What lessons can India’s “BRIC” comrades offer when it comes to scaling up its welfare system?

Institution transformation:  Formal versus Informal

China:

Under the current health care system, local governments in China spend a significant share of their budget on healthcare and social expenditures while the central government contribution is much lower. Over the years, the local governments in China have emerged to be powerful actors, both on the expenditure as well as revenue front.

But how did local governments in China become so powerful?

The historical context of this transformation dates back to the leadership of Mao, according to  Jean Oi, scholar of Chinese politics at Stanford. Mao’s system of setting production targets for food and industrial production institutionalized a system where each level of government contracted “targets” on the revenue front with the subsequent level of government. This spawned indirectly a system of performance-based management where the government set performance targets and tracked indicators at the lowest level. Jean calls them village governments due to the their entrepreneurial spirit.  The pressure to raise revenues and meet the performance standards from higher level of governments forced the local units to become more dynamic in their engagement with businesses.

Thus the process of institutional transformation in China was initially informal, where the system of setting performance targets and meeting them for industrial production triggered such a system  for social sector program. Today, however, local government officials’ performance is assessed not just on economic growth and industrial development in their territory but also based on human and sustainable development.  Each of this component gets an equal weight, and decisions regarding revenues transfer and bureaucratic promotions are tied to achieving these overall targets and performance benchmarks on economic and human development front according to a study on “Performance Management in People’s Republic of China: A study of accountability and vertical control in the implementation of public policy” by Burns & Zhiren in 2010.

 Brazil:

Contrary to China, the process by which the role of local governments dramatically transformed in Brazil was more formal. The 1988 constitution amendment was a major turning point in the history that declared health as a right and mandated allocations towards health and education from the federal government as well as local governments. Local governments share of public spending increased from 18 to 22 percent, almost 3.5 percent of GDP, cites an article on “Brazil’s System of Local Government, Local Finance and Intergovernmental relations,” by Souza & Celin.Furthermore in 2002 there was a constitutional amendment which required local governments to earmark 15 percent of their budgets as well as from constitutional transfers to health programs (Souza).

 Municipal elections were already taking place, but combined with their increasing clout in allocating budgets,  policy innovations began to emerge at the local level. Several innovations in governance such as participatory budgets, cash transfer programs were experimented at the local level, which were then replicated across several cities.

 India

When it comes to India a major point of institutional transformation has occurred with the National Rural Health Mission, which is changing the role of local governments or the “panchayati raj institutions” by giving them more planning powers.  Though the 73rd amendment was supposed to change the role of local governments, the process has still been gradual.  Since the Panchayat Empowerment and Accountability Incentive Scheme launched in 2005-06 and attempts to deepen the devolution process by launching the devolution index, local government’s capacity to raise revenues and spend is still very low compared to countries like Brazil and China. According to the Devolution Index in India latest report,  there has been expansion of the local government’s responsibilities in planning and execution of projects and schemes  sponsored by the central and state governments, taxes and spending powers still continue to be very low.  As of 2012-13, share of local governments as a part of state government’s revenue is still barely 1 percent or even less for most of the local government institutions. 

 Institutional transformation at local level through UIDAI:

At present, UIDAI is developing a system to make electronic payments to welfare recipients and has the capability by which a government official at any level will know the status of the delivery or payment to a beneficiary.  In the future this could very well pave the way for the government at each level to track far more indicators and outcomes.  For instance, in case of beneficiaries under NRHM’s health insurance schemes for the poor,  UIDAI could make it possible to track other indicators such as utilization level of the beneficiaries, hospital admission rates, readmission rates,  duration of the hospital stay and other quality indicators for health outcomes.  And based on these indicators for the welfare scheme recipients, local governments could infuse more power in terms of getting more resources from the higher level of governments or could use the same to battle their electoral turf wars.  In Brazil, policy innovation has occurred at the grassroot level thanks to the electoral and fiscal clout of the local actors.  In contrast China lacks electoral power but strong position of local governments to spend on welfare programs and raise revenues for the central government has made  it possible to enforce accountability from the central government and rapidly scale up its welfare programs.

Mao may well have said that power flows from the barrel of the gun. Today the situation is power flows from the purse strings of the local governments.


Paradox of the State of Health


State

Current MMR Cumulative target For 5 years in MMR Current IMR 5 years IMR target CurrentInstitutional Deliveries % 5 year target for institutional deliveries %
Gujarat 148 60 44 24 93.4 97
A.P 134 70 46 23 95.0 100
Assam 381 228.6 58 29
Karnataka 178 (SRS 2009) 80 38 15 97.3 99
Chattisgarh 269 (SRS-2009) 215 54 30 52 95%

The paradox of the state of health is that health is a state subject. For anyone who reads the annual report of the Ministry of Health and Family Welfare, this may seem to be an irony because under the National Rural Health Mission, almost 70-75 percent of the funds flow from the central government to the states. Going forward, the government is aiming to increase the contribution by the states to almost 40 percent. As per the constitution, the central government stipulates the laws and much of the program implementation and delivery is by the state. Perhaps this explains to an extent why some states have shown more initiative in implementing health sector reforms against others. It is quite interesting how states are setting their own targets for the next five years to improve key health outcomes such as infant mortality rate, maternal mortality rate, total fertility rate and number of institutional deliveries. Gujarat is aiming to reduce MMR from the current 148 to 60 in the next five years.  Andhra Pradesh wants to reduce MMR from the current 134 to 70.  And for Assam, the goal is to bring it down from a high of 381 to 228.

The good news is that there states are setting their goals to improve health outcomes; the bad news is that there is wide scale disparity that exists. Even though states are setting their targets and many have shown improvement over the years, central government funding is not tied to states achieving these performance benchmarks. Since central government already funds a chunk of these programs, it could consider introducing certain categorical grants or project-based grants to the states under which states compete to grab a share of it.  Globally, this is quite common in some of the developed countries where the federal government funds some of the projects of the states based on achievement of some of the key performance indicators. One possible way is to develop an incentive mechanism through which states can be rewarded for achieving outcomes. For example, in the US, the No Child Left Behind Act is based on the federal government’s funding is conditional upon the states meeting some of the shared goals in terms of student achievement and graduation rate.

Unfortunately, political pressure many a times overrules strict enforcement of such performance incentive mechanism due to which even when states do not meet some of the goals,  they continue to get funded. As my Professor, Dr. Swiss notes, “It is fairly common for the Feds to impose certain standards on states and local governments, and to say those standards be met to get a full share of money in the future years. But it is also common for the Fed to back down, and keep the funding for the program even if those standards are not met. These waivers are mainly for political reason-Congressional members don’t want their districts to be hurt.”

While instituting a performance-based management system from the top to the lowest levels of the government may not be a complete panacea to lower disparities, in the Indian context it can do two things:

1)      Strengthening Institutions of Governance:

As funding gets tied increasingly to different levels of government meeting some performance benchmarks and being rewarded for their innovation, the upshot of this would be an increase in accountability in government and strengthening of the institutions.  “How do you explain outcomes in certain states in comparison to others? So it is institutional strengthening in some parts ( which explains this). It is no longer ( a problem of ) scare resources –it is how you utilize them and how you allocate them,” asserts political scientist, Sumit Ganguly at a seminar hosted by the Center on Democracy, Development and Rule of Law at Stanford.


2)      It will increase competition among the states for central government’s funds

If competition is good for the private sector, it will good even for governments.  And increased pressure to compete for funds for basic welfare programs such as healthcare and education, will lead to an increased focus on public policy issues within governance rather than the current parochial lens of caste and identity-based politics.  Dr. Ganguly points to the fact that identity-based politics continues to gain resonance rather than real public policy issues such as a primary health care clinic or improved primary education as they have a longer gestation period in terms of electoral gains.


Rwanda-Fixing Each Spoke of the Wheel of its Health Sector

Rwanda

This month Rwanda bagged the 2012 Resolve Award for innovation in reproductive and child health presented by Aspen and administered by USAID and Management Science of Health[i]. This comes as a little surprise not just for the progress it has made on the maternal and child health front but with a bouquet of innovations spanning across its health sector.

It seems to have been first mover on many policy developments. It was one of  the first countries where performance-based financing was pioneered[ii]. Today it has been scaled at a national level with performance contracts enforced between the local units and the President, Paul Kagame[iii]. Its community-based health financing scheme, called as Mutuelle De Sante covers almost 90 percent of the population, and is only health financing scheme to have been scaled up to this extent. When it comes to technology-based initiatives too, Rwanda was among the early birds to get started with the eRwanda project to be the first eGovernment project that got supported by the World Bank in East African countries in early 2003[iv]. In 2009, when Rwanda launched the telemedicine project in partnership with the Ministry of Health, it allowed regional hospitals to be connected with advanced hospitals, thus enabling doctors to seek remote diagnosis, second opinion or send referrals to the advanced hospital. Today it looks like it is reaping the benefits of its early investment in technology with projects in mobile health being rolled out such as TRACNet, which makes  it possible for health workers in distant locations to record real-time data regarding treatment of their AIDS patients.[v]Thanks to such early adoption of technology that a recent evaluation noted that about 80 percent of health workers now report data on patients and treatments using cell phones.[vi] This is not enough. To overcome the shortage of skilled workers it has a signed an agreement with United States, worth $34 million to bring more than 100 senior medical faculty from American universities to Rwanda over the next seven years in an effort to to train and work with the local physicians and build specialty capacity as well as create new residency programs, writes Ms Agnes Binagwaho, Rwanda’s Minister of Health on her blog website.  Ms Agnes, who is a trained physician and a lecturer at Harvard Medical School, boasts of her ministry’s partnership with elite US medical school such as Harvard, Duke, University of Texas, Yale School of Medicine and about seven schools for nursing and midwifery.

This begs the question as to what makes this country a hub of innovative health policy and programs and what lays the context for this country to become a darling of donors? Its infant mortality rate which climbed to 149 in 1995 post genocide from 99 in 1990 has been brought down to 49 by 2010.  Under 5 mortality rate too, which  increased to 183 from 164 in 1990 stood at 64 in 2010. Maternal Mortality Rate is now at 340 from 910 in 1990s.

After the genocide that decimated about 30-40 percent of the population or had them flee the country, there was a shortage of health workers and financial resources. Local non profits and church organizations such as Cordiad, MSH, USAID initiated performance-based schemes in some of the provinces. Rwanda’s strong emphasis on a decentralization policy reflected in its key documents such as country cooperation strategy with multilateral organizations and created a firm grounding to enable such contracting mechanism with a focus on outputs to be enforced.

While the process began in 1996 with the support of W.H.O and through the formation of health districts, it was in 2006 that the process kick started with the government launching Imihigo (performance contracts) in order to achieve its targets and indicators. These intentions were articulated as a part of its Vision 20:20 and Poverty Reduction Strategy Paper. Echoing a similar spirit was the Economic Development and Poverty Reduction Strategy for 2008-2012, which envisaged that 80 percent of the district by 2012 would be using performance contracts, citizens score card and report delivery services, thereby increasing accountability. And its latest decentralization strategy document 2012 states that the central government would reduce its earmarked grants to local units in order to encourage the latter to improve their planning and budgeting capability and give them more autonomy.

As the evaluation kicks in this month for the districts, Rwanda’s current minister for local government, James Musoni said,”The annual performance of all districts, provinces and Kigali City will be evaluated by a national evaluation team composed of senior officials and experts from different institutions led by the President’s Office.” A statement on the local government website noted that the evaluation will assess the implementation progress in all priority sectors and targets indentified in the performance contracts signed between the mayors and the President. It further said that through Imihigo, the government will identify major challenges that impede effective implementation of targets and by showcasing the performance and ranking of each district, the government hopes to promote competitiveness amongst districts as well as identify areas that need strengthening.”

While this doesn’t make a case for any causal argument or even a correlation, intuitively it does seem to be right: you cannot have a strong performance-based system without a solid base for decentralization; you cannot have a community-based financing scheme at a national level without commitment of local units to organize groups; you cannot have workers in remote areas to report data on real time basis accurately through projects like telemedicine without reinforcing the culture of local autonomy and performance-based system. And you cannot have collaborative partnerships with American universities without having the political will and the culture to innovate and bring reforms. It is like fixing each spoke of a wheel when it comes to improving outcomes in social sector. You get one spoke right but if you can’t fix others it is hard to achieve desired results. Rwanda seems to have learnt this much early.


[i] Rwanda Ministry of Health http://moh.gov.rw/english/?p=2797


[ii] Rena Eicher, Ruth Levene, Performance-based financing for global health: potential and pitfall 2009


[iii] Rwanda, Ministry of local government website http://www.minaloc.gov.rw/


[iv] World Bank, Project Appraisal Document for Rwanda

[v] Ministry of Health website

[vi] Nsanzimana S, Hinda R, Lowrance DW, Cishahayo S, Nyemazi JP, Muhayimpundu R, Karema C, Raghunathan PL, Binagwaho A, Riedel DJ. “Cell phone- and internet-based monitoring and evaluation of the national antiretroviral treatment program during rapid scale-up in Rwanda: TRACnet, 2004-2010.” JAIDS 2011; 59(2): e17-e23

Rwanda Human Resources website: http://hrhconsortium.moh.gov.rw/about/participating-us-schools/

PBF Changing the health system in Rwanda, WHO  Bulletin, 2006, Cordaid Website